AI-centered data reporting to understand repeat purchasing
When you have a hero SKU with sizing variations, it’s difficult to understand the behavior between variants.
Are customers moving from the smaller sizes to the larger sizes?
Are they trading down to save on cost?
Are they even subscribing to the SKUs we want them to subscribe to?
I’ve been able to use AI to understand what’s driving the purchase, and then also understand what this means for repeat across each of the SKUs and their variants.
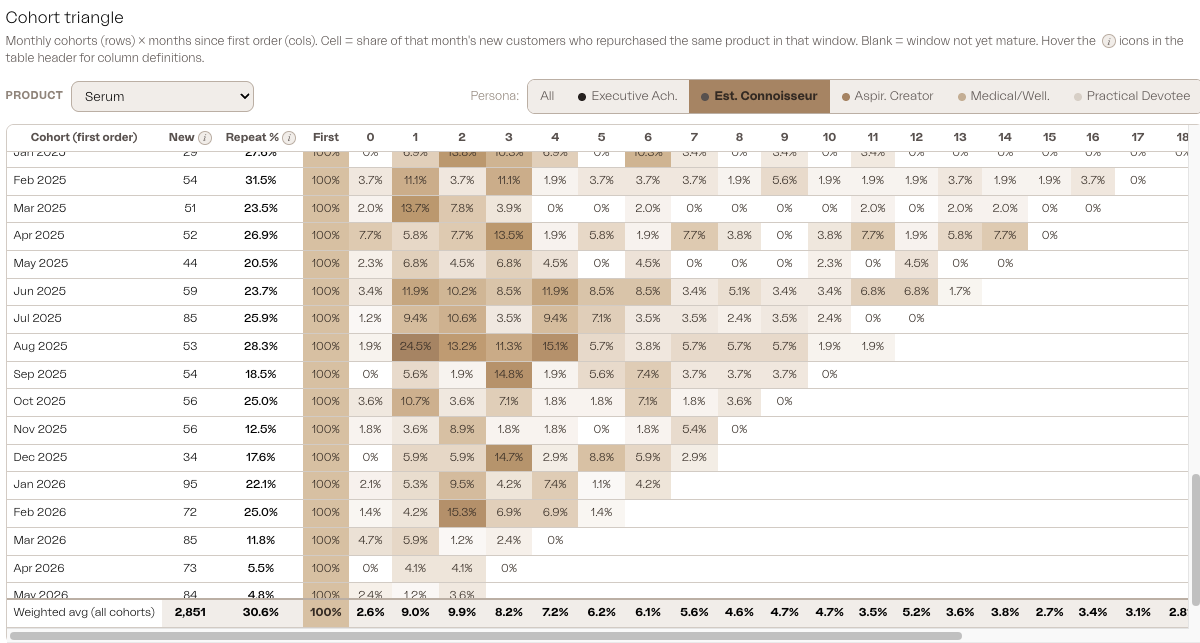
Cohort repeat, by persona
Understanding who is purchasing was just the start. We then broke it out by month to further target the persona, by the month they entered the brand and made their first purchase.
Using this data, we can understand if the cohort is meeting benchmark repeat rate, or if they’re falling behind. We can then utilize our different CRM levers to target the behavior directly.
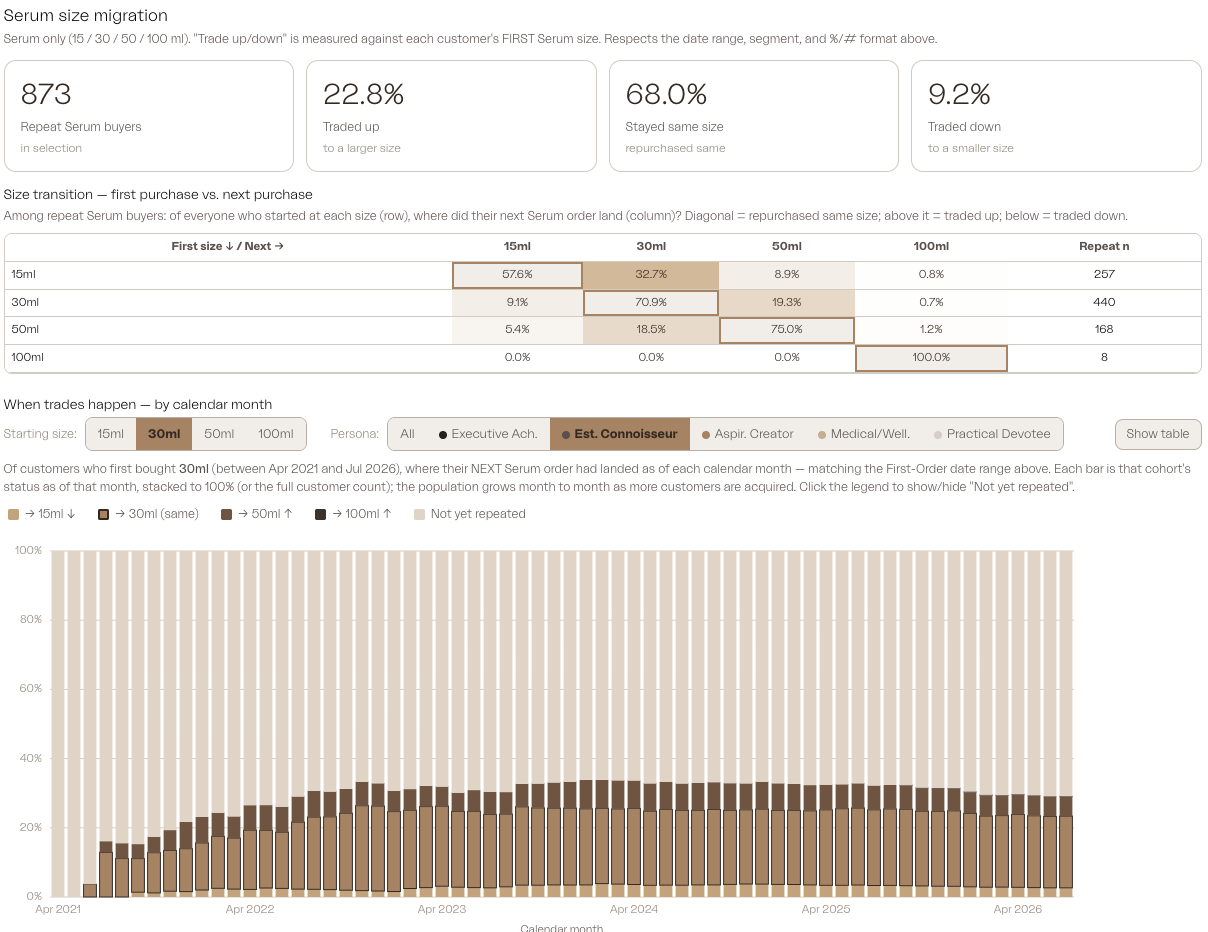
Understanding variant migration by SKU
Understanding who drives your LTR is one thing, but we need to better market into the SKUs that drive the business forward. Reporting migration behavior helped see the behavior across variants for our hero SKU. This data helped us better understand the behavior per persona, per variant.